Key takeaways
- The July 2026 update spans reporting, modeling, the Service and mobile — most changes are additive, so existing reports keep working.
- Headline features: modern visual defaults, conditional formatting for line charts and legends (GA), TMDL view on the web, and Model Options in the Service.
- Org apps gain audiences, bookmarks and PowerPoint storytelling — plus new management APIs.
- Plan ahead: from October, Power BI Desktop versions from March 2026 or earlier lose save-and-share to OneDrive and SharePoint.
Microsoft ships a Power BI update every month, and the July 2026 release is a solid one for report authors, data modellers and administrators alike. This is our plain-English summary of what changed, why it matters, and what UAE finance and operations teams should do about it. Watch Microsoft’s official walkthrough below, then read the full breakdown — with the key features illustrated.
Reporting
The report canvas gets the most visible improvements this month.
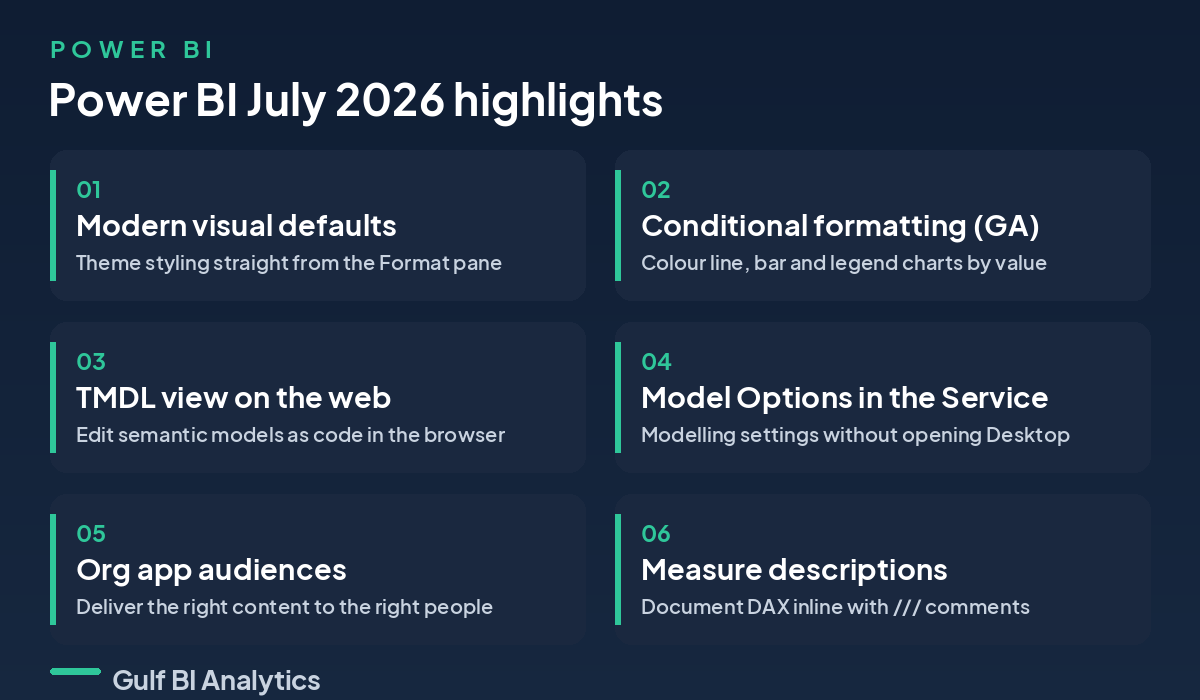
Modern visual defaults (preview)
Applying a consistent look across a report used to mean editing a theme file or formatting each visual by hand. Modern visual defaults let you customise the current theme directly from the Format pane: set your colours, palette and default formatting once, and every visual and page picks them up. For teams that produce a lot of branded reports, that means faster work and far better consistency — a base theme you can layer custom styling on top of, without leaving Power BI Desktop.
Conditional formatting for line charts and legends (now generally available)
Conditional formatting — colouring a visual based on its values — now reaches line, bar, column, pie and donut charts that use a legend, and it is generally available. You can apply a gradient or rules so a line turns green when a value is high and red when it is low, or colour each series by category.
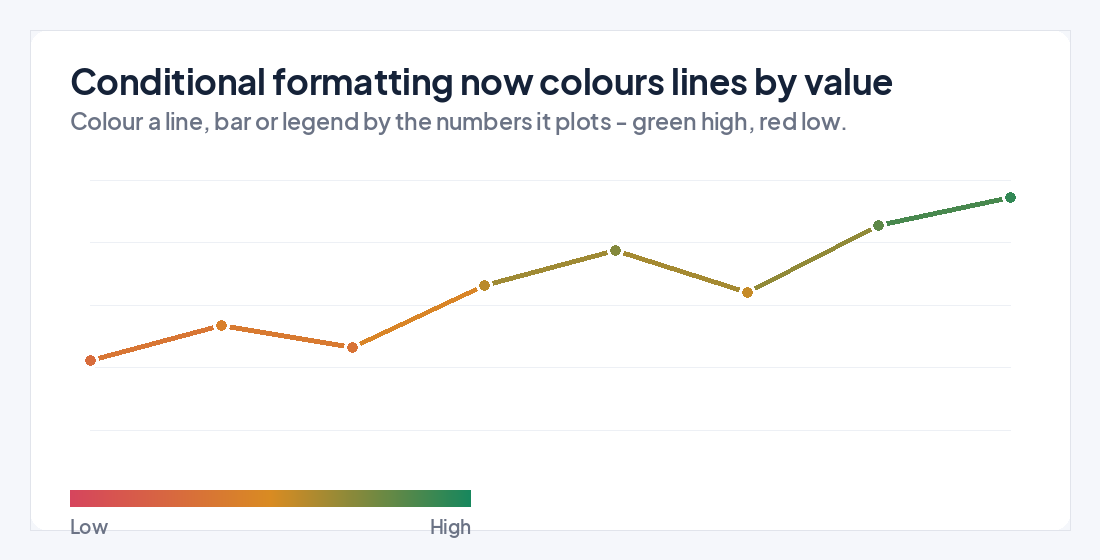
A practical use: colour a revenue line green when it is above target and red when it slips below, so the story is obvious at a glance — exactly the “pair every number with a signal” habit we cover in our KPI dashboard design best practices.
Smaller reporting touches
Two quality-of-life changes round out reporting: dragging page tabs now auto-scrolls at the edges, so reordering pages in large reports is smoother; and a consistent “space above” property replaces the old “space below” for subtitles, dividers and the plot area, making spacing more predictable.
Organisational apps grow up
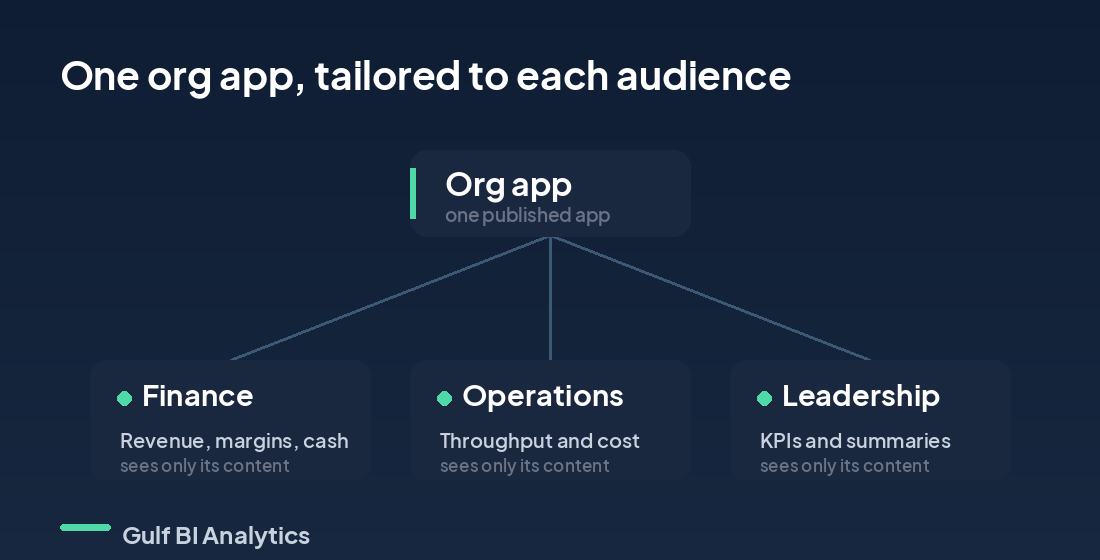
Org apps gained three useful capabilities: audiences, so one app can show different content to different groups; bookmarks, so viewers can use both author-created and personal bookmarks; and PowerPoint storytelling, so live report pages can be embedded in slides. Together they let a single app serve finance, operations and leadership without three separate builds.
Modeling
Modellers get several governance and quality-of-life wins this month.
Measure descriptions with triple-slash comments
You can now document a measure right where you write it, using the same triple-slash (///) syntax found in many programming languages. The description becomes part of the model, so it appears for anyone who uses the field later — no separate documentation to keep in sync.
Revenue YTD =
/// Year-to-date revenue in AED,
/// respects the report’s date filter.
CALCULATE(
    [Revenue],
    DATESYTD( 'Date'[Date] )
)
It is a small change with a big payoff: models that explain themselves are far easier to hand over and maintain.
TMDL view on the web
Tabular Model Definition Language (TMDL) describes a semantic model — tables, columns, measures and relationships — as human-readable code. July brings a TMDL view to the browser, so you can script and apply model changes in a code editor directly in the Power BI Service. Why it matters:
- Source control. Text-based definitions work naturally with Git, so model changes can be reviewed and versioned like any other code.
- Bulk edits. Renaming or reformatting many objects is far quicker in a code editor than clicking through dialogs.
- Repeatability. The same definition can be applied across environments, supporting proper development, test and production workflows.
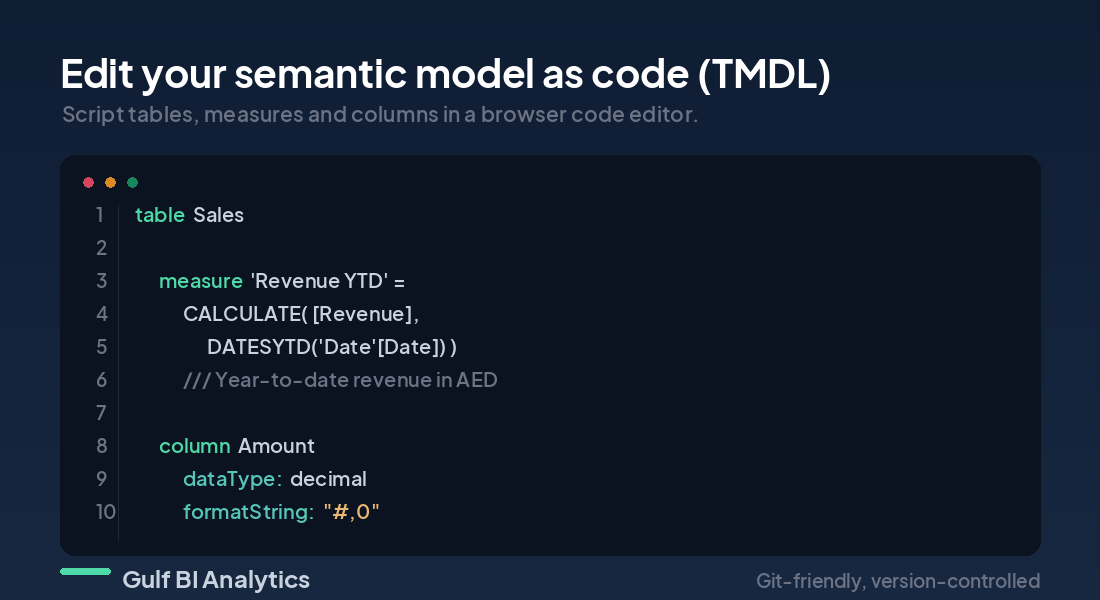
This is the code-first, governed approach we build into every serious model — and it pairs neatly with automating Power BI reports with MCP.
More modeling updates
Web modelling now includes the Model Options dialog (type detection, relationships, time intelligence, parallel loading, locale and DirectQuery), so you can configure a model without switching to Desktop. From August, semantic model settings open in a side pane instead of a full page, so you keep your context. And for visual calculations, the LOOKUP function adds an INFERRED mode that works out which axis columns your coordinates imply.
Power BI Service and APIs
For administrators and platform teams, July adds automation hooks:
- CRUD APIs for org apps and audiences. Create, read, update, delete and list org apps and their audiences programmatically.
- CRUD APIs for paginated reports. Paginated reports now support lifecycle management through REST APIs — useful for deployment pipelines and governance at scale.
Mobile
Org app audiences reach the mobile apps. The tailored organisational-app experience now extends from the Power BI Service to iOS and Android, so people on the move see the content meant for them.
One deprecation to plan for
Mark your calendar: from October 2026, Power BI Desktop versions from March 2026 or earlier will no longer be able to save and share files to OneDrive and SharePoint. If your team standardises on an older Desktop build, plan an update before the deadline to avoid disruption.
New third-party visuals
The certified-visual ecosystem also moved this month, with updates including Drill Down Scatter PRO by ZoomCharts, neutral variance colour in Zebra BI Tables, a Heatmap by Powerviz, and Gantt by Profitbase v3.1.
What this means for UAE teams
A few practical implications for finance and operations teams across Dubai and the UAE:
- Faster, more consistent reports. Modern visual defaults and wider conditional formatting make it quicker to produce clean, on-brand dashboards — the design discipline we teach in our Report Design Master Class.
- Better governance. TMDL on the web and measure descriptions support documented, version-controlled models — the foundation a trustworthy report needs.
- Cleaner content delivery. Org app audiences and the new APIs help larger teams get the right content to the right people, and automate it.
- An action item. Check which Power BI Desktop version your team runs before the October OneDrive and SharePoint change.
Get more from every Power BI update
New features only pay off on a well-designed, governed model. Gulf BI Analytics helps UAE teams keep up — through Power BI consulting in Dubai and hands-on Power BI training on your own data. Book a free consultation and we will help your team adopt the features that matter most.
Source: Microsoft’s official Power BI July 2026 Feature Summary. Feature availability (preview vs general availability) may vary by tenant and region.
Frequently Asked Questions
Where do I get the Power BI July 2026 update?
Power BI Desktop updates through the Microsoft Store or a manual download, and the Power BI Service updates automatically for your tenant.
What is the biggest change in the July 2026 update?
It depends on your role: modern visual defaults for report authors, TMDL view on the web for modellers, and org app audiences and APIs for administrators.
What is TMDL view on the web?
It lets you edit a semantic model as code, using Tabular Model Definition Language, directly in the browser - useful for source control and quick, precise model changes.
What is the October 2026 deprecation about?
From October, Power BI Desktop versions from March 2026 or earlier can no longer save and share files to OneDrive and SharePoint, so update Desktop before then.
Will these features change my existing reports?
Most are additive. Existing reports keep working; the new theming and conditional-formatting options give you more control, not forced changes.